Overview
Risk Disruptors delivers reporting tools and comprehensive data visualization that help organizations optimize industrial performance and safety. Our specialists apply advanced visualization techniques and powerful analytics to transform complex data into clear, actionable insights.
What you get
- Real-time customized dashboards
- Interactive drill-down reporting
- Predictive modeling and forecasting
- Stakeholder-ready outputs

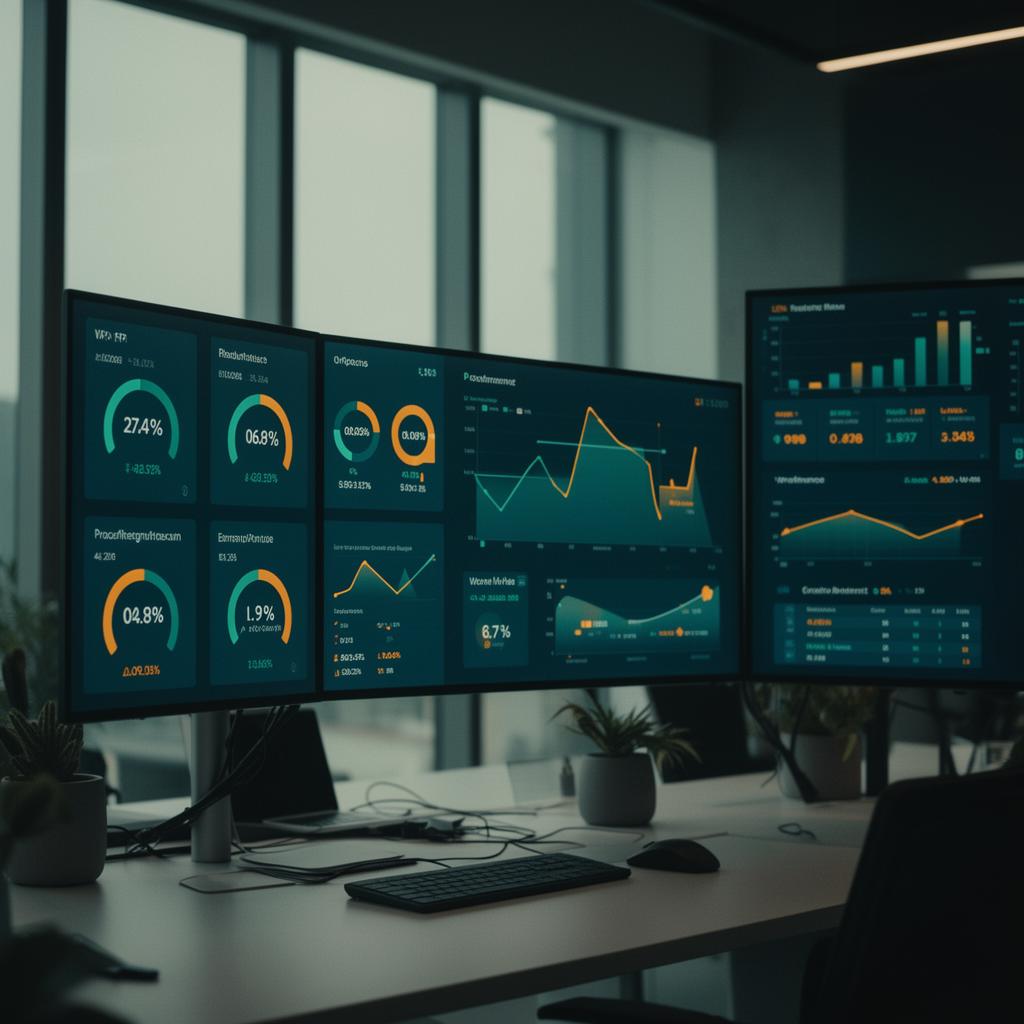
Personalized Dashboards
Our customized dashboards provide real-time access to key metrics and performance indicators. Each dashboard is tailored to the specific needs of the client, ensuring that critical information is readily available and clearly understood by every stakeholder.
Interactive Reports
Beyond static charts and graphs, our interactive reports enable users to explore trends, drill into the underlying data, and uncover insights that would otherwise remain hidden. These reports are designed to help clients quickly identify improvement opportunities and support confident, data-driven decisions.
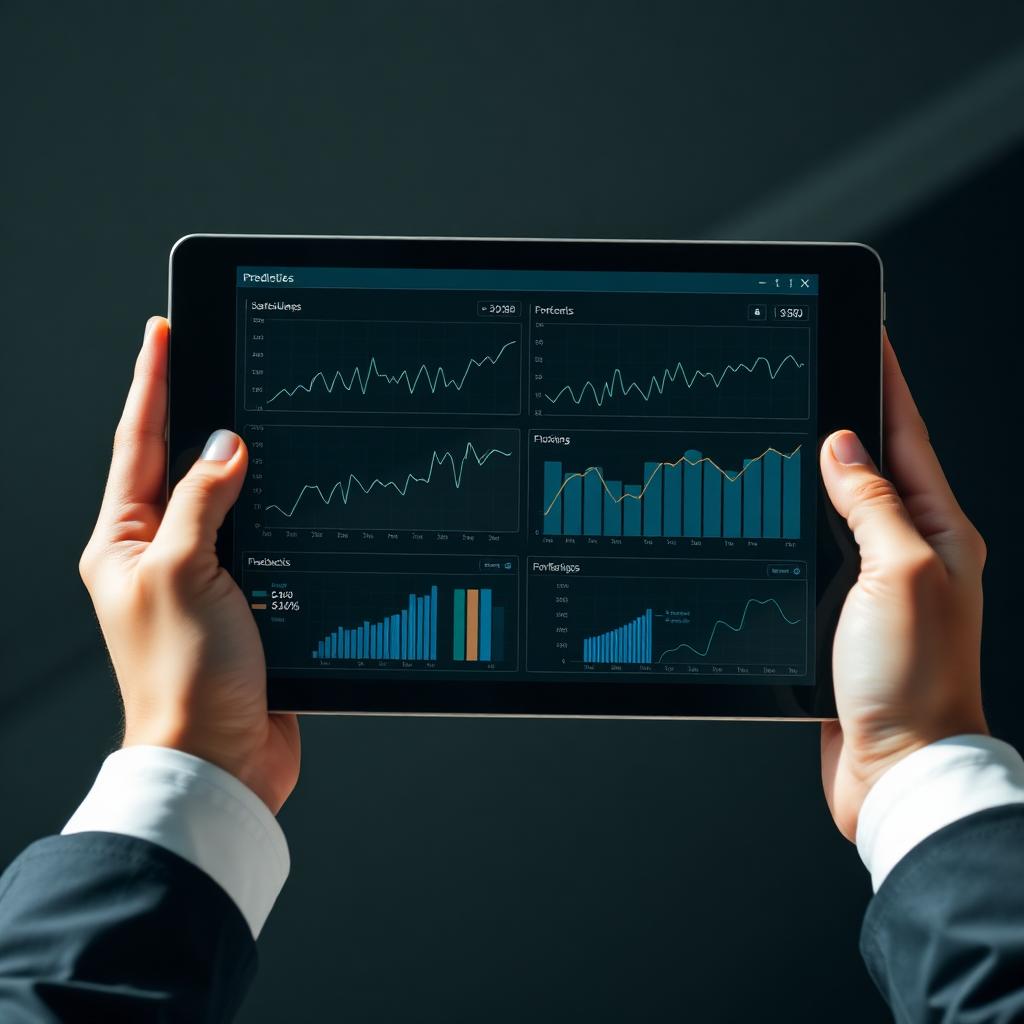
Predictive Analytics
By combining historical data with advanced algorithms, our predictive analytics enable organizations to anticipate and mitigate potential risks before they materialize. Leveraging artificial intelligence and machine learning, our models identify patterns and project future outcomes, empowering clients to make proactive decisions that protect safety and performance.
Explore more